Uses
Counting tags
The basic use for the tagnet utility is to count tags and display the counted occurences
for each of the tags.
You need to provide a directory with text files containing the prompts in a path command-line argument.
tagnet.py --path ./prompts --mode count_tags
Filtering
You may also need to filter tags by the number of occurences.
For now, these are the supported modes (you can put whitespaces between mode and a number):
=, >, <, >=, <=
Examples:
tagnet.py --mode count_tags --filter "=1"
tagnet.py --path ./prompts --mode count_tags --filter ">1"
tagnet.py --path ./prompts --mode count_tags --filter "< 3"
tagnet.py --path ./prompts --mode count_tags --filter "<= 8"
tagnet.py --path ./prompts --mode count_tags --filter ">=5"
Tag graph
Displaying an approximate graph
Often, a prompt contains several tags, for example:
Sunset in a forest ; VRay ; 3D ; High detail
We’ve got two co-occurences:
VRayand3DHigh detailand3D
Edges for this command are weighted, based on an amount of said co-occurences in all available prompts.
To generate and see it, write:
tagnet.py --mode display_graph --path ./prompts
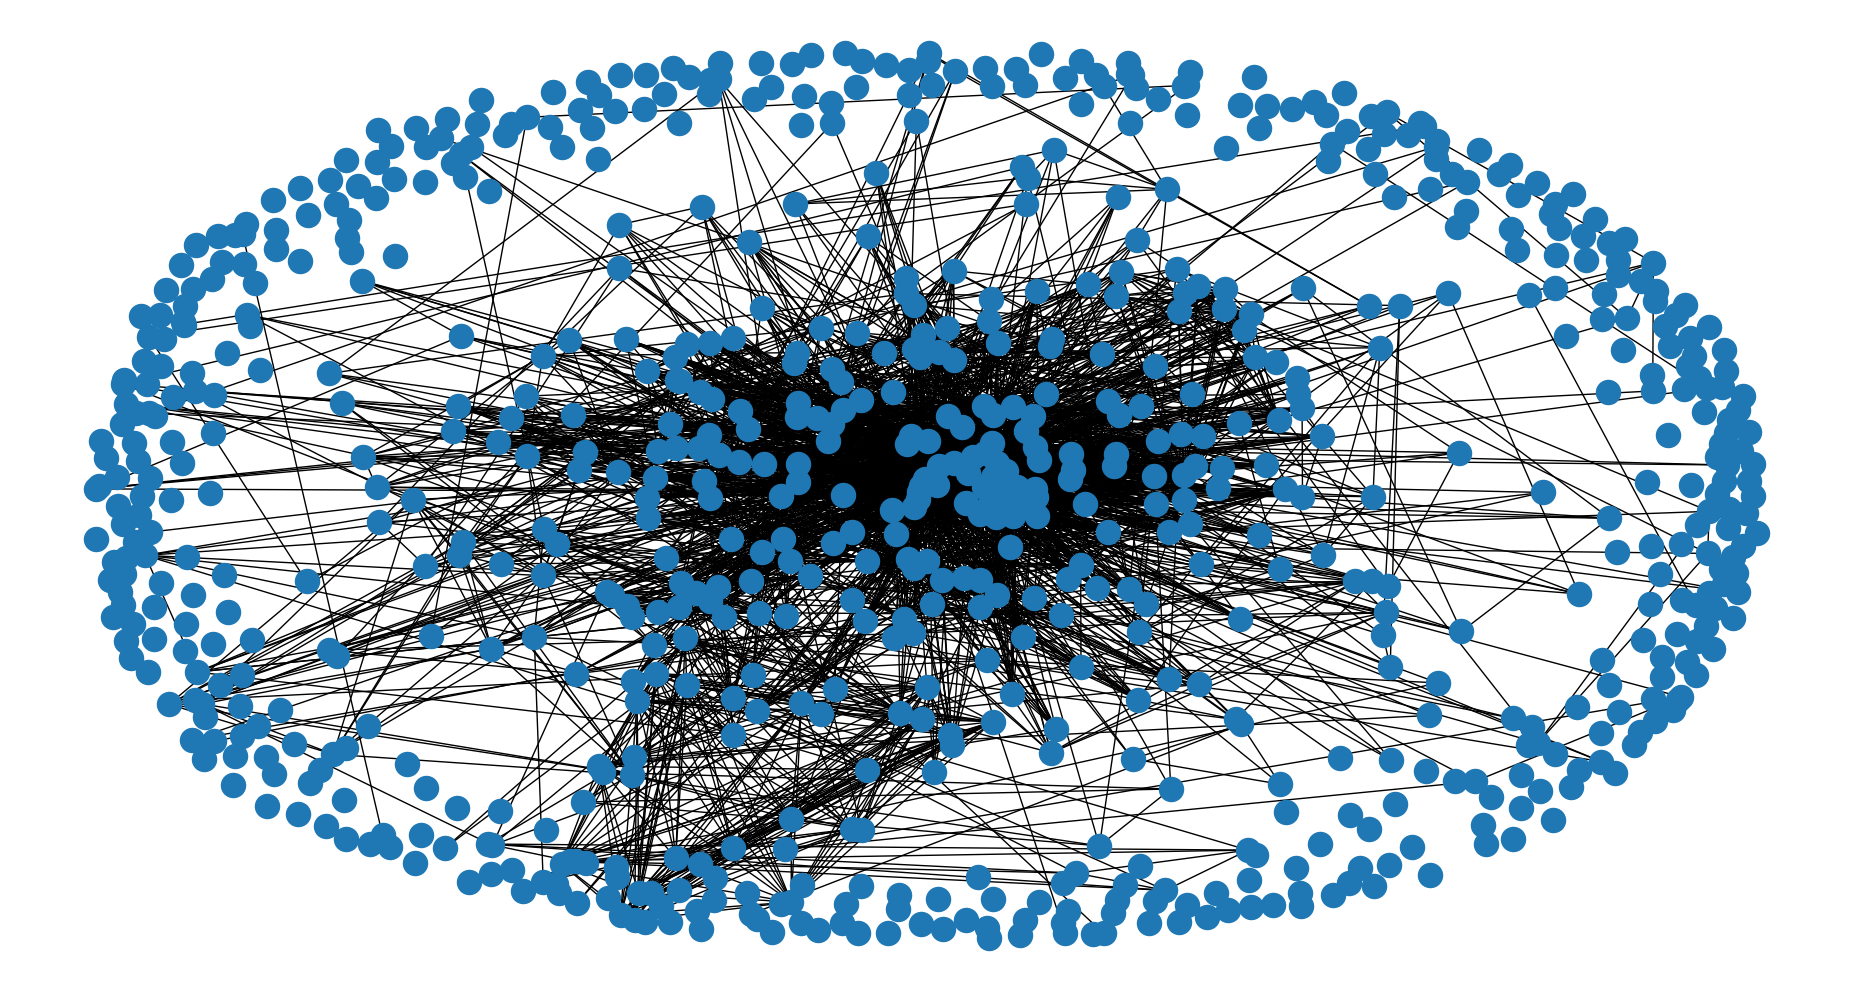
The graph is using Matplotlib and WxWidges and looks like that.
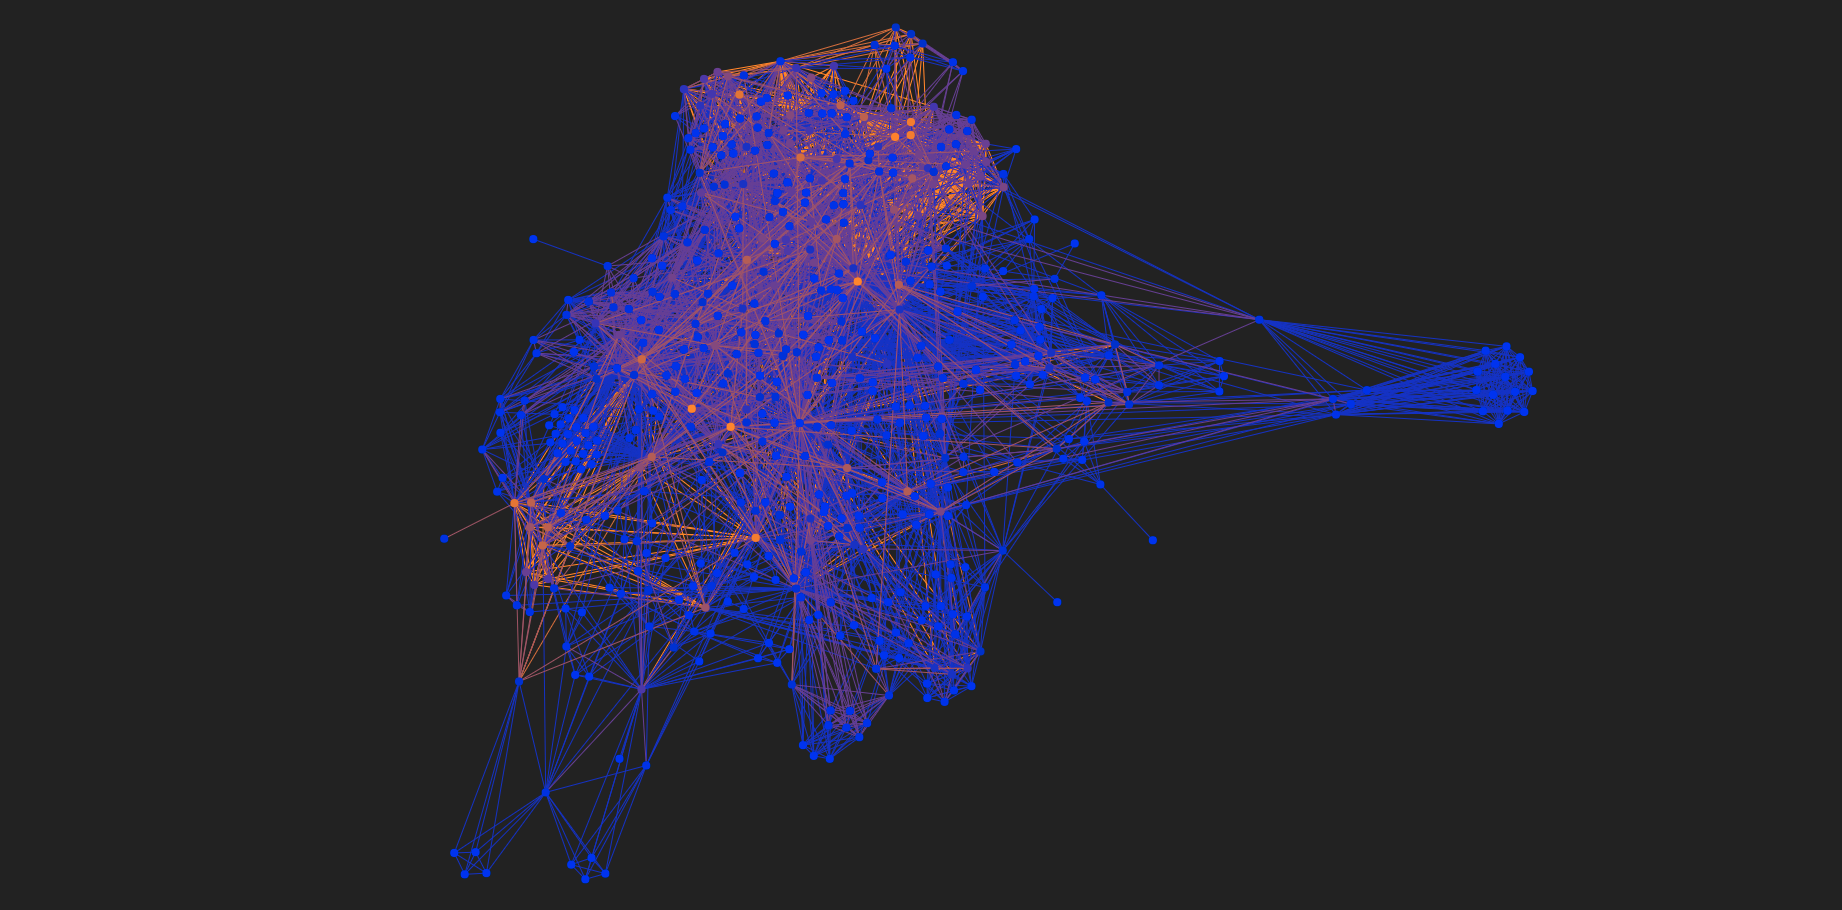
Displaying a web graph
There’s a frontend side of the project: CLIP graph visualized. You may want to watch an online demo with existing tags or build your own tag graph and watch how it differs:
# Replace "your_path" with a path containing prompt directory and available for JSON file export
# --path is a prompt directory
# --output_file is a path to a new JSON output file
tagnet.py --path ~/your_path/prompt_directory --mode export_graph --output_file ~/your_path/graph.json
Now you can clone the visualization repository to use it locally and copy the generated graph.json as a data source.
# Clone a repository
git clone git@github.com:6r1d/CLIP_graph_visualized.git
cd CLIP_graph_visualized

# Copy a graph.json
cp ~/your_path/graph.json ./graph.json

# Run a Python 3 webserver locally on a 8080 port
# (any other webserver with static file support might work)
python3 -m http.server --bind 0.0.0.0 8080
Now, by visiting “http://0.0.0.0:8080” or “http://127.0.0.1:8080”, you’ll be able to see your own graph version. The visualizer is using a force-graph library by Vasco Asturiano. It allows you to zoom in and out, see tag names and shift the workspace.